Parks California’s staffer visits 103 state parks, finds hundreds more reasons to love our state
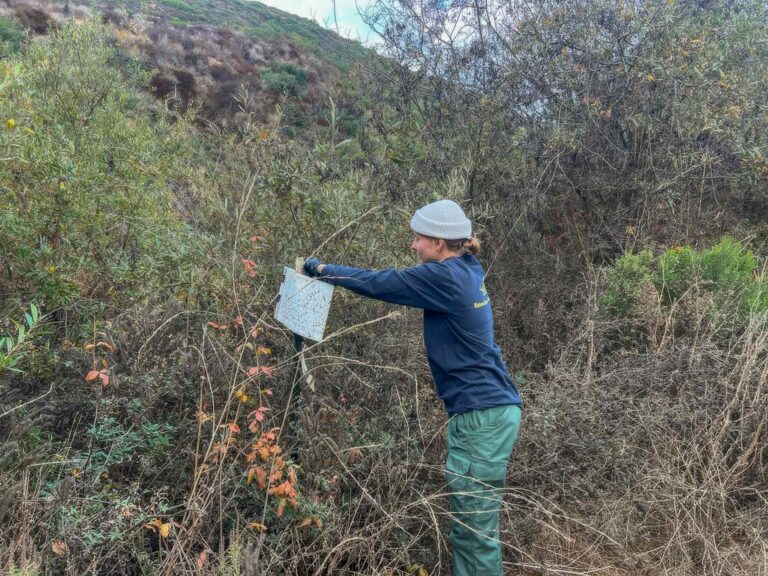
At Parks California, it’s no surprise that we love our California State Parks. During 2024, the team took up the challenge to use the app OuterSpatial and visit as many state parks as they could schedule. One staff member, Veronica Silva Miranda, led the pack in unique park visits.