“Climate change relative to what…?” is a central question for climate science.
How climate changes and how fast depends on what the reference is. The most common reference is conditions before the human-induced effects of the Industrial Revolution kicked in sometime between 1800 and 1850. This exemplifies how the longest instrumental records such as those of sea level, and ocean temperature and salinity provide irrefutable evidence that global climate has changed over the past 200 years, and how.
As stewards of roughly a quarter of the coastline, California State Parks relies on long-term data to guide assessment, mitigation, and adaptation of our coastal parks and beaches for the inevitable impacts of climate change.
June 21, 2024 is #ShowYourStripes Day, part of an internationally observed campaign to spread awareness about climate change. The campaign uses the iconic “warming stripes” graphic to visualize and display average annual temperature trends over the last 100+ years. Read more about the #ShowYourStripes initiative here. Blue (cooler) to red (warmer) colors illustrate temperature gradients each year, with darker colors representing more extreme temperatures, both cold and warm. California State Parks and Scripps Institution of Oceanography (SIO) adapted the #ShowYourStripes concept to display ocean temperature changes over time. These powerful visualizations (here) show substantial variability with obvious, strong warming along the California coast since about 1980.
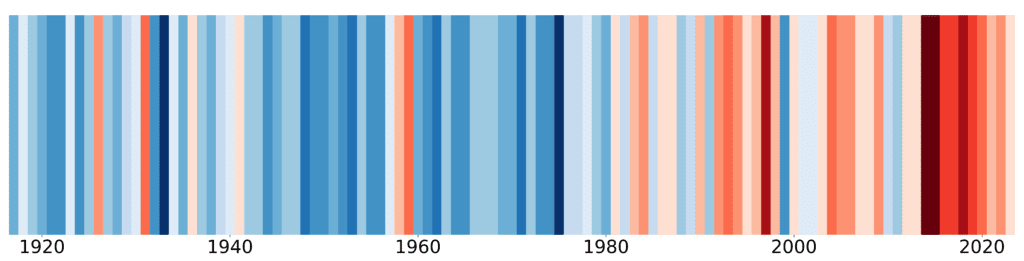
Scripps Pier, La Jolla – Sea Surface Temperature
In anticipation of #ShowYourStripes day, we talked about these observations with three scientists from SIO and California State Parks managing one of the world’s longest sea surface temperature monitoring programs.
Beginning as early as 1916, the SIO Shore Stations Program, implemented by countless volunteers, students, partners, faculty, and researchers has collected daily temperature and salinity measurements at 10 stations along the California coast from Humboldt to La Jolla. These data are the longest continuous such records in the Pacific.
Meet the SIO and California State Parks scientists involved by reading our in-depth interviews to learn more about their efforts to monitor an important part of our changing climate.
Dr. Reinhard E. Flick is a coastal oceanographer with 55 years of experience and co-Principal Investigator of the SIO Shore Stations Program. He retired from California State Parks in 2020 as Staff Oceanographer and Oceanography Program Manager. A co-founder of the SIO Center for Coastal Studies, he remains at SIO as a Research Associate and consulting coastal oceanographer.
Melissa Carter is a biological oceanographer, plankton expert, and co-Principal Investigator of the SIO Shore Stations Program. She has been a staff researcher at SIO for 25 years, and oversees and maintains long-term ocean observations, including the Automated Shore Stations Program and the California Harmful Algal Bloom Monitoring and Alert Program.
Nick DaSilva is a Senior Environmental Scientist managing the Oceanographic Research Program at the California State Parks Natural Resources Division in Sacramento. For 50 years, the State has invested in coastal management research through a dedicated oceanography program, a unique government-to-academia relationship that was originally convened by the California Department of Boating and Waterways and is now overseen by California State Parks. Partnering with public California universities, the State’s Oceanography Program works with scientists to answer key coastal change and management questions by applying the best and latest coastal processes and ocean research results.Editor’s Note: These interviews have been edited for length and clarity.
Parks California: Can you share more about the partnership between Scripps Institution of Oceanography and California State Parks?
Nick DaSilva: This year, State Parks is celebrating the 50th anniversary of California’s Oceanography Program. Since 1974, the State of California and Scripps Institution of Oceanography have collaborated to administer an Oceanographic Research Program. The program investigates critical coastal management questions and produces science-based guidance for the benefit of coastal managers, California boaters, the public, and the scientific community. Today, the data and tools produced by scientists at Scripps – and other participating public California universities- are translated in real-time to State Parks’ managers to inform our department’s responses to coastal challenges including storms, coastal flooding, landslides, coastal erosion, and sea level rise. Concurrently, Oceanography Program-funded data has been cited in 13,000+ government policy documents and scientific publications and used to develop derivative products that are accessed by thousands of Californians every hour.
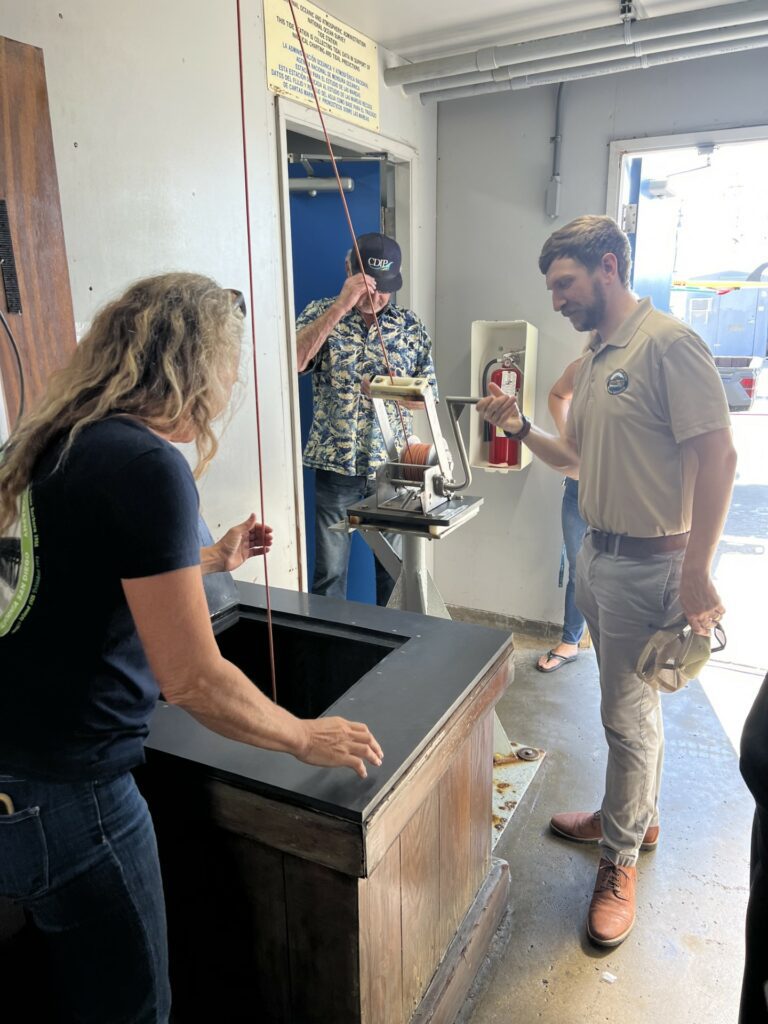
Nick DaSilva measures ocean temperature.
Parks California: How did the California State and Scripps Institution of Oceanography cooperative ocean research program get its start?
Dr. Reinhard (Ron) Flick: The start of the State/SIO Oceanography Program dates back to 1974 when the California Department of Boating and Waterways (DBW) sought to address the profound lack of wave information along California’s coast by hiring Dr. Richard Seymour, a recent SIO graduate, as Staff Oceanographer to be stationed at SIO. He had initiated the Coastal Data Information Program (CDIP) wave measurement system with start-up funding from the State, Sea Grant, and the US Army Corps of Engineers.
I was hired by DBW in 1984 when Dr. Seymour left the position. I was able to expand the Oceanography Program significantly over four decades, conducting and sponsoring peer-reviewed, published research on a broad range of coastal and ocean processes important to boaters and the state in general.
We supported scores of students and their research, as the program continues to do, ranging from undergraduates to post-docs. Many of the best known and most productive California coastal researchers benefitted from our support. One of the best examples is Dr. Bill O’Reilly whose SIO Ph.D. thesis forms the basis of modern coastal wave and surf modeling and forecasting now used globally by science and surfing communities through platforms like CDIP and Surfline®. One of Bill’s mentors was the late Professor Walter Munk who as a young student at SIO, together with his mentor Dr. Harald Sverdrup, created the wave forecasts at Normandy for the 1944 D-Day invasion. The value of long-term creation and improvement of science can never be overstated.
The Oceanography Program was able to step up with support for the SIO legacy Shore Stations Program about 20 years ago when it was struggling to find funding. Ongoing support from the State underscores its recognition of the program’s significance for coastal management and adaptation.
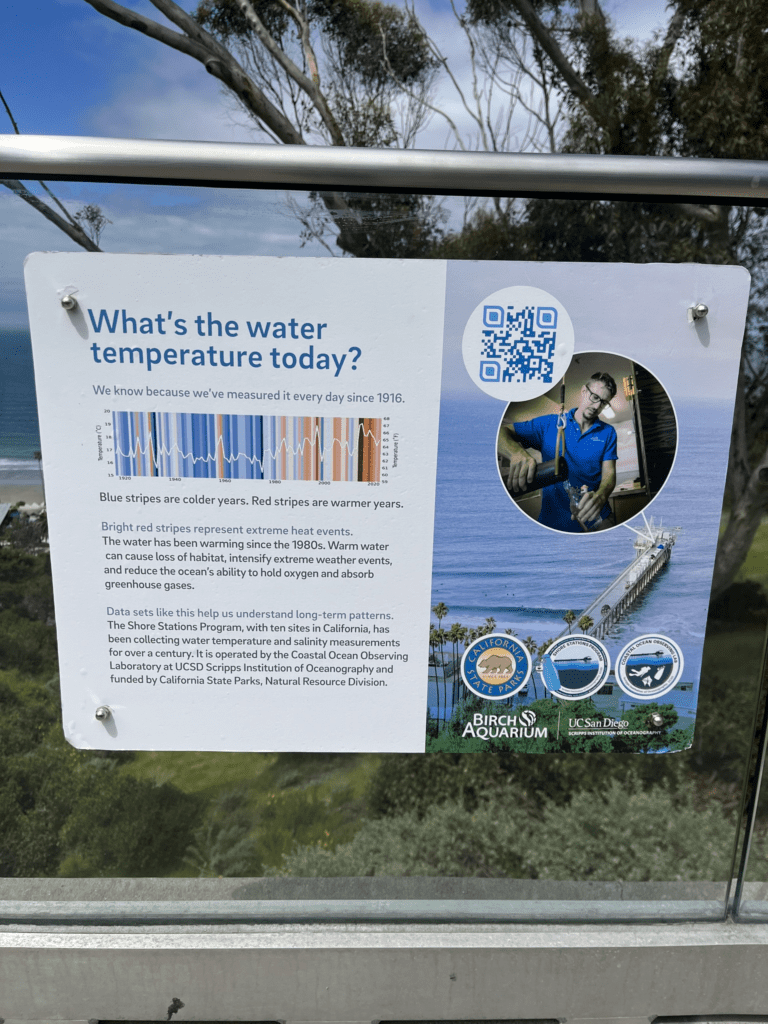
A public sign made in collaboration with the Birch Aquarium.
Parks California: Could you provide an overview of the Scripps Institution’s Shore Stations Program and its role in monitoring the ocean and the coast?
Melissa Carter: The Shore Stations Program, initiated in 1916 at Scripps, began by collecting daily temperature and salinity measurements along with weather and tide data. Currently, there are 10 shore based monitoring stations in California, with Scripps being the sole collector of both sea surface and bottom observations. Four out of 10 stations have been operational for a century or more, making this program an invaluable and irreplaceable record of ocean temperature. Scripps with 108 years of observations is the longest, continuous ocean temperature and salinity record in the Pacific.
Parks California: What are the top three key findings or trends observed through long-term monitoring efforts at the Shores Station program? Anything in particular that really has surprised you in the results?
Dr. Flick: I want to call the results gratifying, not surprising. The first is the large-scale correlation between Scripps Pier temperature measurements and much larger scale Pacific Ocean water temperatures, and even air temperature conditions across continental North America, as pointed out in 1998 by John McGowan and others in the journal Science. This is strong evidence that the Shore Stations measurements both reflect and inform us of global changes, not just conditions near the California coast.
The second key finding concerns marine heat waves, which are similar to atmospheric heat waves. Over the last century Shore Stations data show both the number and intensity of marine heat waves have increased as quantified in a peer-reviewed published study. The work shows the 2°F (1.15ºC) rise in ocean temperature over the last century explains these trends and illustrates the value of long-term measurements.The third set of findings was recently published in Nature by Sierra Byrne, a UCSD undergrad at the time, and others. She looked at the salinity record at SIO and found two things, one short-term, one longer term. First, short-term fluctuations in ocean salinity are, of course, affected by rainfall. So, during heavy rains the ocean surface water gets fresher, which is no surprise. However, recovery back to the more salty, normal condition can be delayed because of stream outflow that can persist for weeks after the rain stops. The main conclusion is that longer-term, decadal changes in Scripps Pier salinity are related to extreme rainfall variation over the entire Southwestern United States, over both ocean and land. These findings show that higher coastal ocean salinity at Scripps Pier reflects the latest several decades of drought over the southwest, as well as past more stormy and wet decades.
“When warm events occur, there is a synchronous timing of warming ocean temperatures events along the entire California coast, indicating large-scale regional impacts.”
Carter: Ron did a great job summarizing the major findings from the Scripps Pier long-term record, so I will just highlight a few interesting points. The century old records of the Shore Stations Program allow us to look back in time and see how often and extreme prior warming events were and compare these to current events. Before 2018, the previous all-time high ocean temperature record was recorded during a heat wave in 1931. The late 1920’s to 1930’s were a warmer period and we experienced extreme drought conditions similar to those over the last decade. Since the 1980s, more frequent El Niños and marine heat waves are occurring due to the background climate and ocean warming. These century-long observations demonstrate the escalating severity of these phenomena in a warming ocean.
Another important observation from this program is that the 5m water temperatures are warming at a faster rate than the surface waters, signaling changes in coastal processes and ocean circulation that can critically impact our ecosystems. There is an urgency to study and measure these changes so that we can comprehend the implications fully.
Lastly when warm events occur, there is a synchronous timing of warming ocean temperatures events along the entire California coast, indicating large-scale regional impacts. While variations exist between the northern and southern regions, warming events can affect the entire coast uniformly. This synchronicity highlights the widespread influence of this warming and the significance in regional climate dynamics.
Parks California: What should people know about ocean warming along the California coast?
Carter: One of the biggest concerns of ocean warming is the rate of warming. If the rate of warming is too fast for life to adapt, we can lose entire ecosystems such as kelp forests and coral reefs, and increase extinction rates of marine species. Ocean temperature is a critical physical factor when it comes to biology and chemistry, and it drives so many systems. It drives metabolisms and general chemical reactions, and much more. We are altering the ocean and we aren’t measuring these systems well enough to document the full impact of these changes.
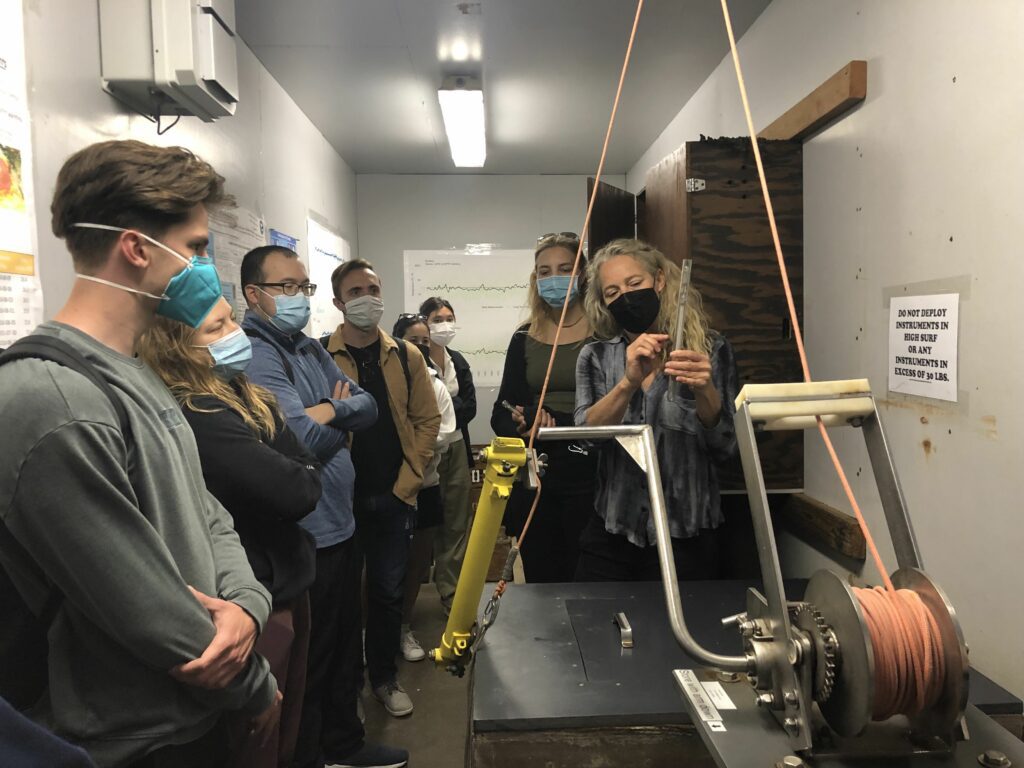
Melissa Carter shows UC San Diego students sampling techniques.
“It’s critical we continue to try to understand how the ocean and marine life are affected by ocean warming and relay that message to the public.”
Also, it’s important to not lose interest in ocean warming because we are bombarded with the news that the impacts are getting worse each year. It can be overwhelming to hear year after year that we’re having more and more marine mammals and seabirds die offs, due to large scale harmful algal bloom events or starvation. We don’t have the resources to know what is causing these die offs and it’s really sad that we aren’t putting the money and effort into it. It’s like people are exhausted hearing about it, and it’s really sad to see, but it’s critical we continue to try to understand how the ocean and marine life are affected by ocean warming and relay that message to the public.
Flick: Temperature and salinity are the two most fundamental parameters characterizing sea water in the oceans. The world ocean is the principle moderator of the global warming that we are experiencing. The ocean absorbs 90% of the excess heat produced by CO₂ and other greenhouse gasses injected into the atmosphere over the last few hundred years. The ocean also absorbs some of this CO₂, which moderates the atmospheric concentration, but also leads to ocean acidification. Acidification is a big deal for many reasons, including a major problem for carbonate shellfish. Subtle and complex ocean chemistry cycles, including the carbonate cycle depend on water temperature and to some extent on salinity.
Carter: We don’t want to forget about intensification of storms with ocean warming. Hurricanes and tropical cyclones are becoming stronger, more frequent, and severe, and that caused by warming ocean temperatures. Increased heat over the ocean increases evaporation and moisture in the atmosphere which generates more intense rain storms and weather systems. These extremes are concerning and we need to better understand how ocean warming changes our weather and climate. Using these programs, we continue to relay that information to the public.
Parks California: Long-term monitoring is crucial for understanding climate change impacts. How does California State Parks use this data to inform management at coastal parks, especially in a changing climate?
DaSilva: Understanding historical data is crucial for managing a changing climate. This Oceanography Program is really powerful in that it not only supports long-term data collection, but also directs researchers to use those long-term data series to develop applied resources which guide decision-making for coastal projects and resilience planning. In doing so, State Parks’ coastal staff can be confident that their management decisions align with best available scientific guidance and can take advantage of practical tools and monitoring systems which inform weather forecasts, public beach goer and boater safety, oil spill response, military activity, commercial port operations, renewable energy assessments, climate science, and the planning, design, and operation of coastal projects and infrastructure.
“The underlying models and math that support these tools are only as powerful as the long-term datasets upon which they are built.”
Oceanography Program partner data is used for both long-term and short-term applications. Whether it’s designing restoration projects for resilient landscapes that can buffer climate change, planning for sea level rise in 30 years, anticipating the severity of next winter’s storm season, or forecasting flooding next weekend, State Parks’ coastal managers can lean on partner data products to inform their work. For example, in San Diego, Oceanography Program partners developed dashboards that notify staff when the weekly weather forecast indicates that key coastal access points (bike trails, parking lots, walking trails) are likely to flood. State Parks staff can then pass along these warnings to the public, or temporarily close areas that may be dangerous during an upcoming storm.
At the end of the day, the underlying models and math that support these tools are only as powerful as the long-term datasets upon which they are built. You can’t accurately predict and plan for the future if you don’t understand the past, and we can only do so today because our predecessors invested in collecting and preserving the long-term datasets which help us understand California’s coastal processes. It cannot be understated how valuable this Oceanography Program has been in building the fundamental science and datasets that inform California’s adaptive decision-making today, and we should acknowledge the prescience of prior Program managers (and modern partners) at the Department (now Division) of Boating and Waterways, who expertly stewarded this program for over 40 years. Today, State Parks’ Oceanography Program team aims to not only utilize these resources to guide management in the present, but also to support their continued maintenance to benefit tomorrow’s questions asked by future generations.
Parks California: What are some things that individuals can do to support the ongoing stewardship of California’s extraordinary coast, especially in the face of a changing climate?
DaSilva: The most important thing the people can do is to stay informed, engaged, and educated about the issues affecting California’s coastline and our planet. Understanding the challenges and being part of the conversation are significant steps, and individuals should never be afraid to ask lots of questions. There is no single solution to the climate crisis, but we can all make impactful individual choices to reduce high-consumption lifestyles and lower our carbon footprints. For those with the socioeconomic stability to volunteer, find a cause that you are passionate about – whether it’s a beach clean-up, a science education program, or native plant restoration – and make your own small difference in your own way. While you’re there, ask questions and explore other stewardship opportunities in your community.
“Hopefully, with understanding, patience, and a collective effort (alongside a healthy dose of science), we can sustainably and equitably navigate the challenging years ahead.”
Our planet is changing, and if we are going to adapt as a species we’ll need to change alongside it. The California that we know and love today will look very different for future generations, and adapting to these changes will be difficult. Hopefully, with understanding, patience, and a collective effort (alongside a healthy dose of science), we can sustainably and equitably navigate the challenging years ahead. Along the way, we at State Parks will continue to do our part to provide for the health, inspiration, and education of the people of California by helping to preserve the state’s extraordinary biological diversity, protecting its most valued natural and cultural resources, and creating opportunities for high-quality outdoor recreation.
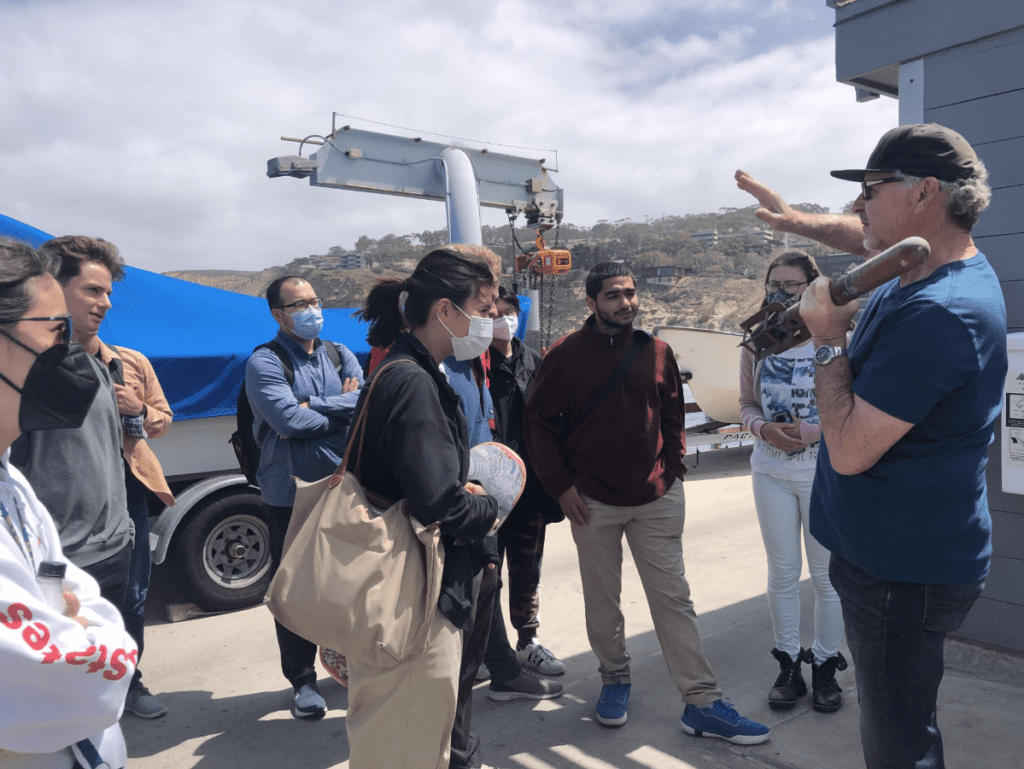
Dr. Reinhard Flick shows UC San Diego students sampling techniques.